1.快速使用leaflet
使用leaflet
a.新建地图
b.在地图上绘制图形
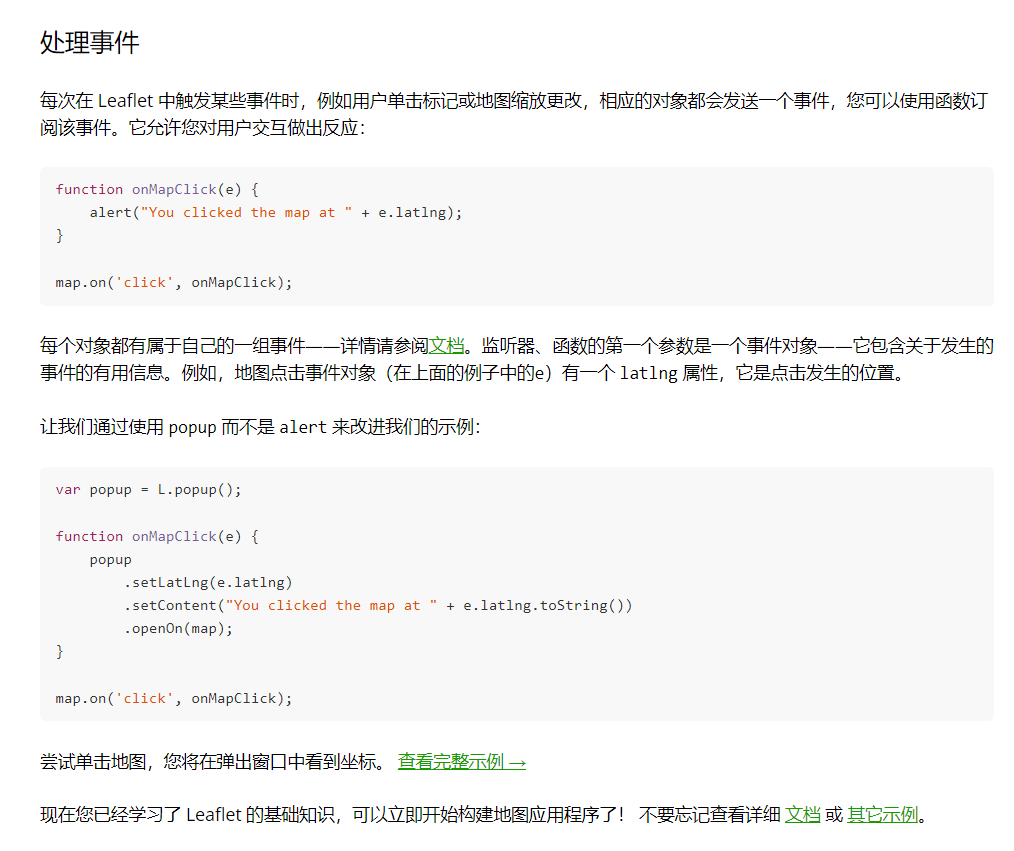
c.使用提示信息
d.处理画布事件
2.项目工程准备
准备如下的目录结构
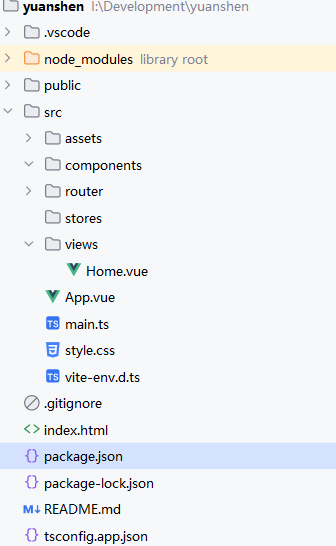
并安装好leaflet依赖,初始化leaflet画布
1
2
3
4
5
6
7
8
9
10
11
12
| function init() {
let map = L.map('map', {
center: [0, 0],
crs: L.CRS.Simple,
zoom: 5
})
console.log(map)
}
onMounted(() => {
init()
})
|
然后将静态的瓦片资源放在public目录中,初始化瓦片地图,添加点击事件
1
2
3
4
5
6
7
8
9
10
11
12
13
14
15
16
17
18
19
20
21
22
23
24
25
26
27
28
29
30
31
32
33
34
35
36
37
38
39
40
41
42
43
44
|
<script>
function init() {
let map = L.map('map', {
center: [0, 0],
crs: L.CRS.Simple,
zoom: 5
})
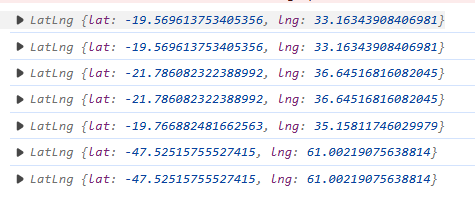
map.on('click', (workingLayer) => {
const coordinate = workingLayer.latlng
console.log(coordinate)
})
L.tileLayer('images/map/{z}/{x}/{y}.png', {
maxZoom: 7,
}).addTo(map);
}
onMounted(() => {
init()
})
</script>
<template>
<div id="map-container">
<div id="map">
</div>
</div>
</template>
<style scoped>
#map-container {
height: 100vh;
width: 100vw;
position: relative;
}
#map {
position: absolute;
height: 100%;
width: 100%;
}
</style>
|
3.实现控制
地图初始化完成后需要优化现有逻辑,比如地图拖拽范围太大,以及缩放太大。翻阅官方文档可知配置Map函数中的option即可

所以配置map option
1
2
3
4
5
6
7
8
9
10
11
12
13
14
15
16
17
18
19
| const bounds = L.latLngBounds(L.latLng(0, 0), L.latLng(-256, 256))
let map = L.map('map', {
maxBounds: bounds,
center: [-102, 148],
crs: L.CRS.Simple,
zoomControl: false,
attributionControl: false,
zoom: 5,
minZoom: 4,
maxZoom: 7
})
map.on('click', (workingLayer) => {
const coordinate = workingLayer.latlng
console.log(coordinate)
})
L.tileLayer('images/map/{z}/{x}/{y}.png', {
bounds,
maxZoom: 7,
}).addTo(map);
|
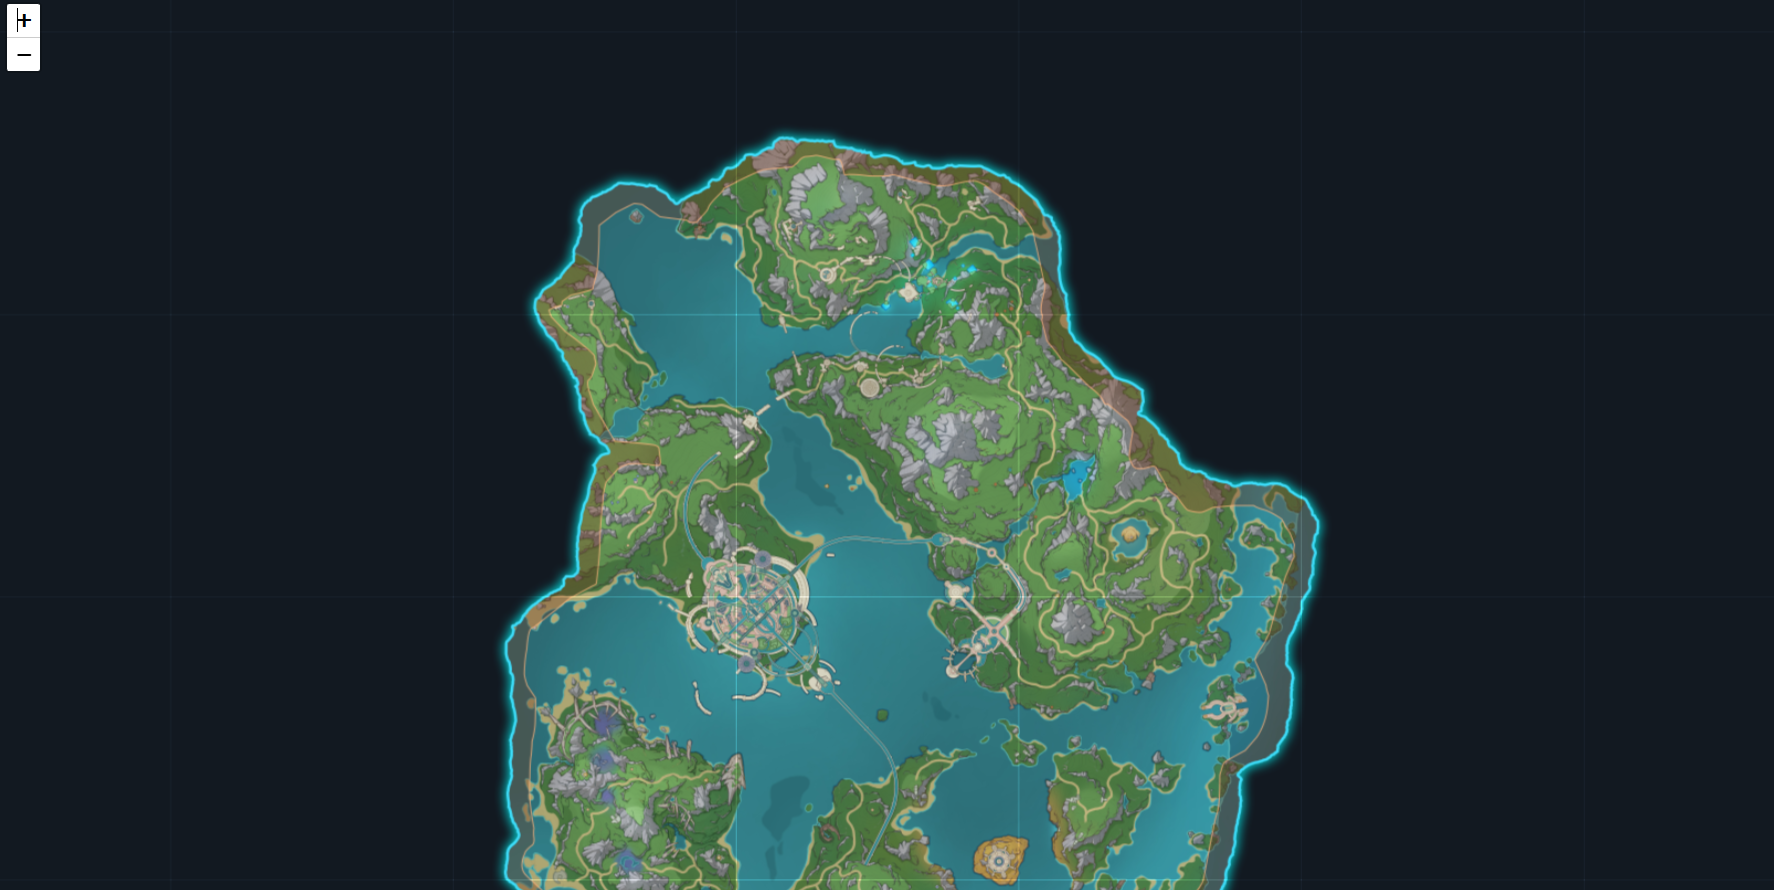
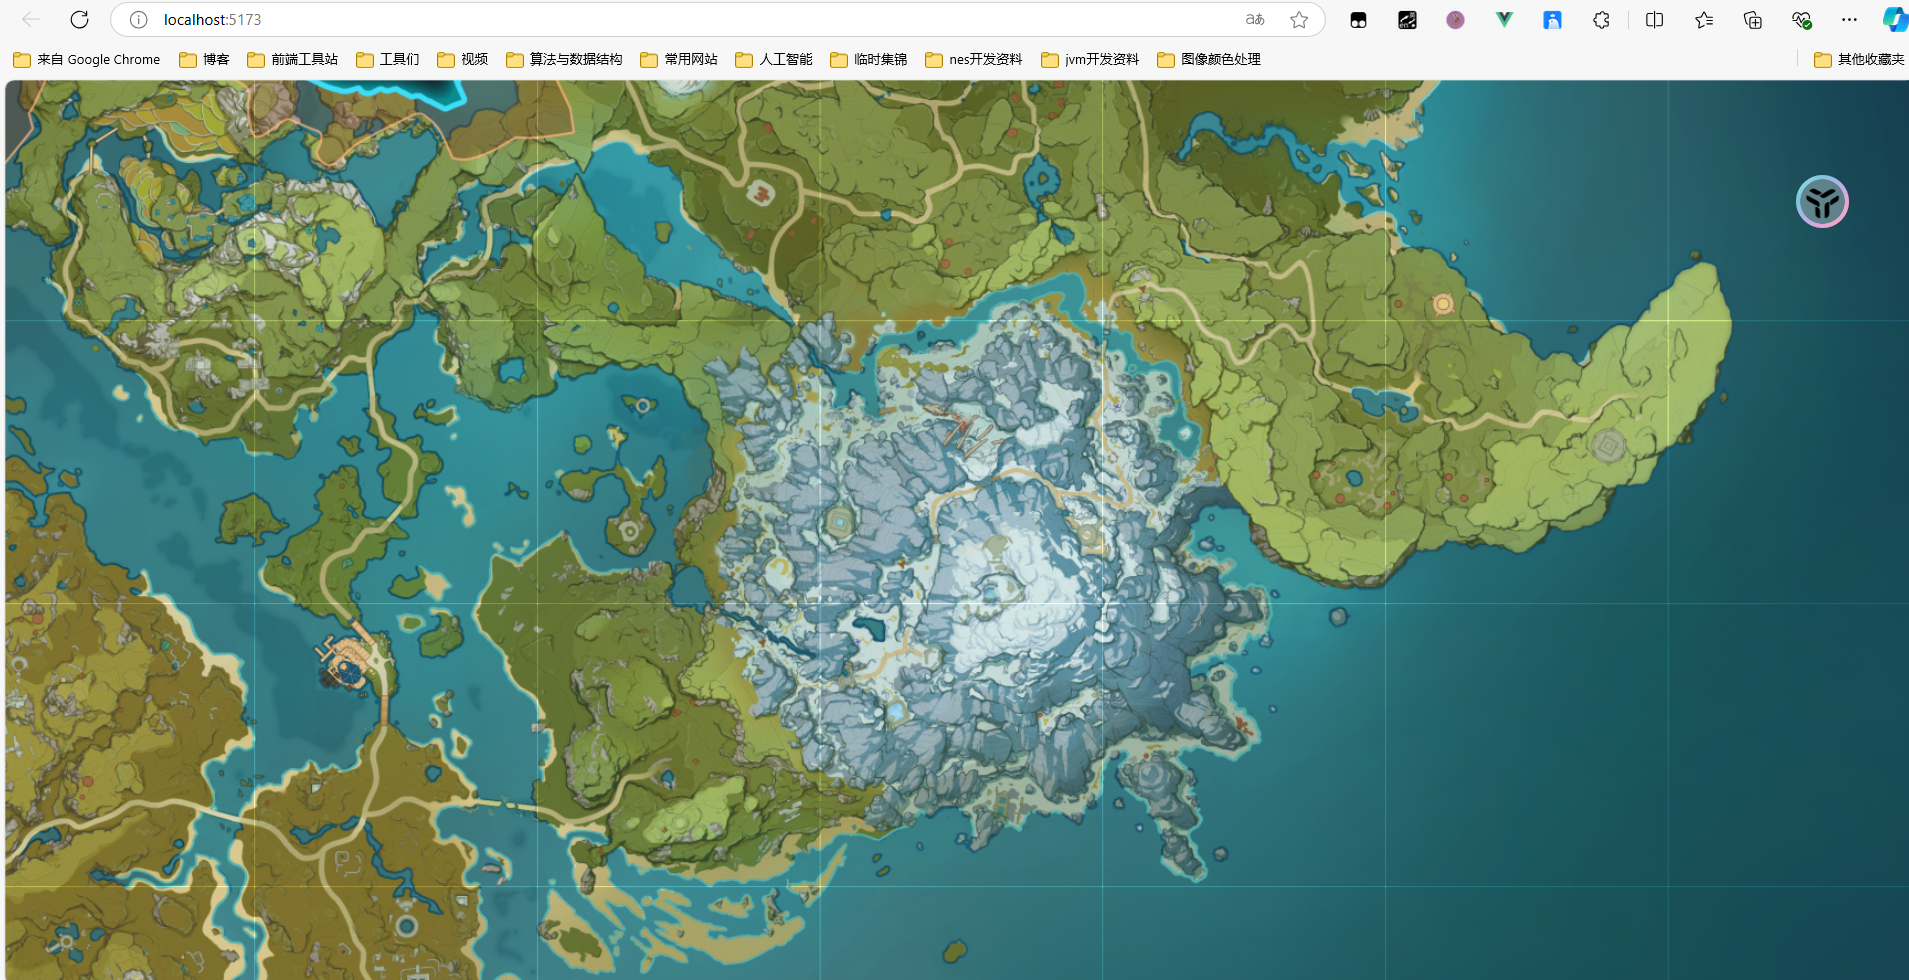
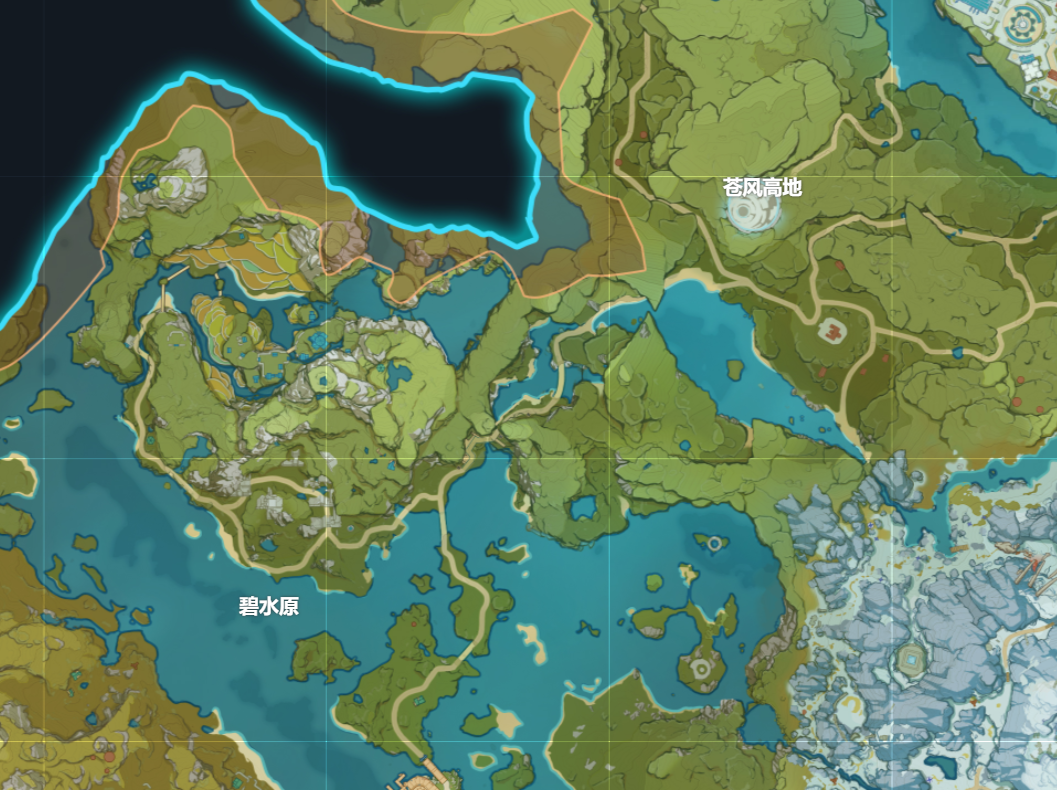
最终效果:
5.在大地图中展示地名
在地图中展示地名可用maker方法
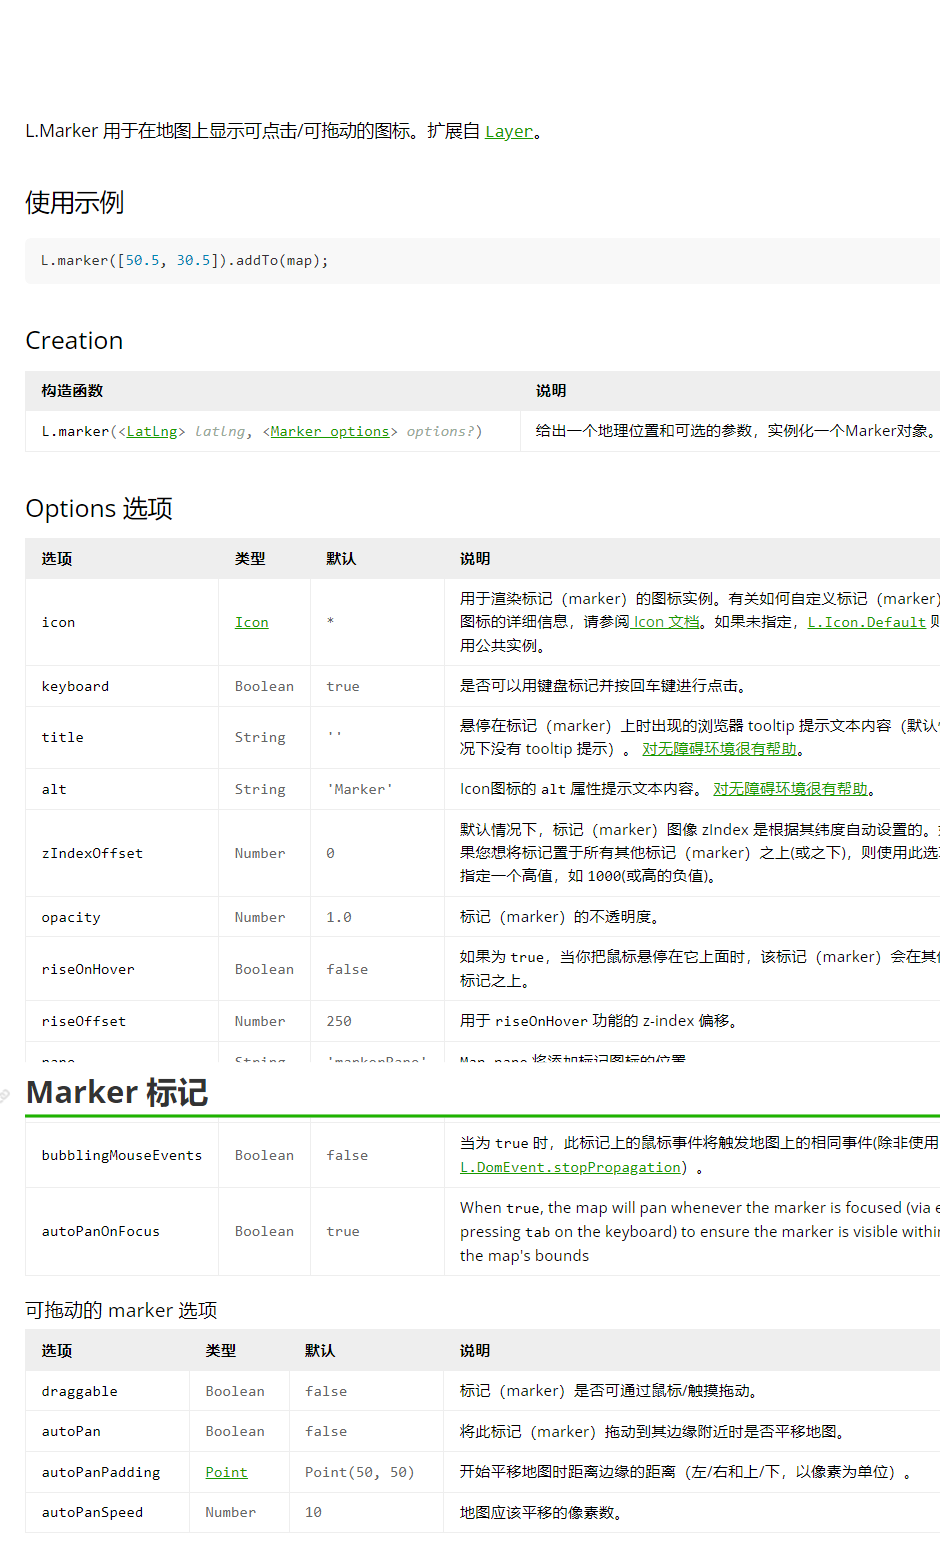
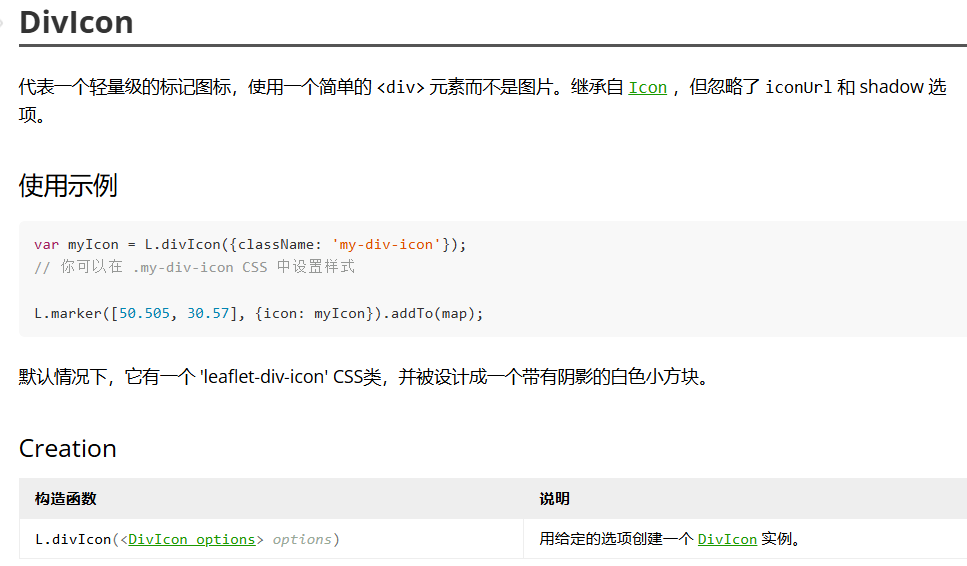
并且注意到maker方法中可以使用divIcon,所以我们可以创建divIcon
1
2
3
4
5
6
| L.marker(L.latLng([-99.96875, 125.769]), {
icon: L.divIcon({
className: 'map-marker-item',
html: `<div class="area-mark-item">碧水源</div>`
})
}).addTo(map)
|
注意在scope上加样式穿透,相关的RFC可以参考scoped-styles-changes
1
2
3
4
5
6
7
| :deep(.area-mark-item){
font-size: 18px;
color: #fff;
font-weight: bold;
text-shadow: 0 0 3px #333;
white-space: nowrap;
}
|
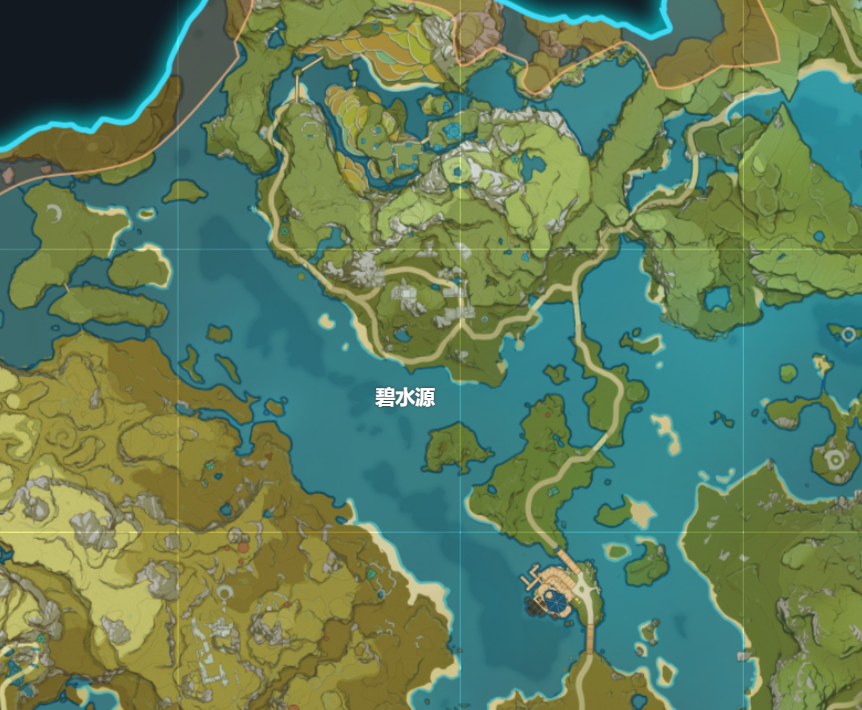
刷新即可看见效果
增加完一个地名证实效果后就可以批量生成地名了。添加一个markerList用于保存地名信息,使用LayerGroup
管理marker
1
2
3
4
5
6
7
8
9
10
11
12
13
14
15
16
17
18
19
20
21
22
23
| const markerList = [{
lat: -99.96875,
lng: 125.71875,
areaName: '碧水原'
}, {
lat: -88.125,
lng: 139.40625,
areaName: '苍风高地'
}]
let markers = markerList.map((item) => {
let {lat, lng, areaName} = item
const marker = L.marker(L.latLng([lat, lng,]), {
icon: L.divIcon({
className: 'map-marker-item',
html: `<div class="area-mark-item">${areaName}</div>`
})
})
return marker
})
let areaNameLayerGroup = L.layerGroup(markers)
areaNameLayerGroup.addTo(map)
|
刷新即可看见效果
6.在大地图中添加标点
效果展示:
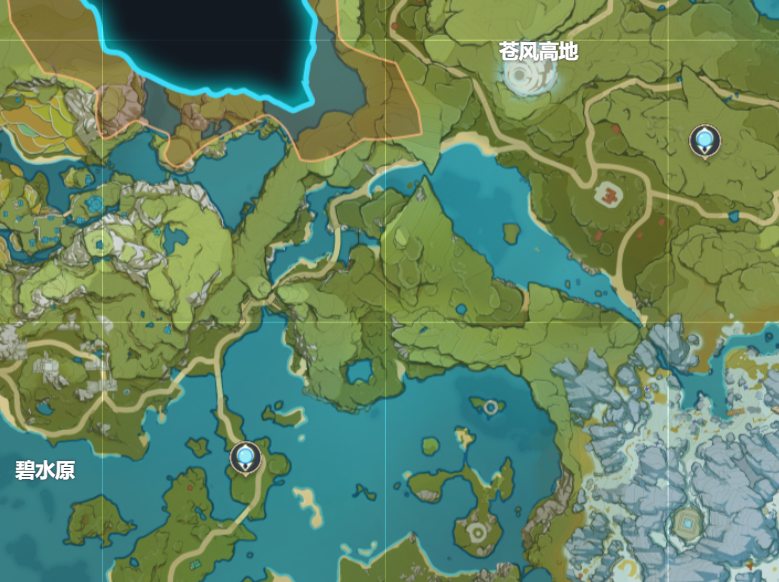
添加标点的实现与添加地名类似,都是在地图上添加marker
首先创建管理数据的pointMarkerList
1
2
3
4
5
6
7
8
9
10
| const pointMarkerList = [{
lat: -90.5625,
lng: 144.65625,
iconId: 1
},
{
lat: -99.53125,
lng: 131.65625,
iconId: 1
}]
|
然后动态生成标点
1
2
3
4
5
6
7
8
9
10
11
12
13
14
15
16
| let pointerMarkers = pointMarkerList.map((item) => {
let {lat, lng, iconId} = item
let iconUrl = `images/map-icon/${iconId}.png`
const marker = L.marker(L.latLng([lat, lng,]), {
icon: L.divIcon({
className: 'map-pointer-item',
html: `
<div class="point-item-container">
<div class="point-pic" style="background-image: url(${iconUrl});">
</div>
</div>`
})
})
let pointerMarkersLayerGroup = L.layerGroup(pointerMarkers)
pointerMarkersLayerGroup.addTo(map)
|
设置标点样式
1
2
3
4
5
6
7
8
9
10
11
12
13
14
15
16
| :deep(.point-item-container) {
width: 37px;
height: 40px;
background-size: cover;
background-image: url("../assets/images/map/icon-bg.png");
display: flex;
justify-content: center;
align-items: center;
}
:deep(.point-pic) {
width: 29px;
height: 29px;
background-size: cover;
margin-bottom: 8px;
}
|
7.代码封装与重构
到目前位置已经初步实现了地图的展示,完成测试后需要及时重构。重构思路为抽离地图创建,地名显示,地标显示
首先抽离地图创建模块,建立map-manager.ts文件并新建MapManager class
1
2
3
4
5
6
7
8
9
10
11
12
13
14
15
16
17
18
19
20
21
22
23
24
| export class MapManager {
private map: L.Map
constructor(domID:string) {
const bounds = L.latLngBounds(L.latLng(0, 0), L.latLng(-256, 256))
this.map = L.map(domID, {
maxBounds: bounds,
center: [-102, 148],
crs: L.CRS.Simple,
zoomControl: false,
attributionControl: false,
zoom: 5,
minZoom: 4,
maxZoom: 7
})
L.tileLayer('images/map/{z}/{x}/{y}.png', {
bounds,
maxZoom: 7,
}).addTo(this.map);
}}
|
然后添加renderAreaNames、renderPoints
1
2
3
4
5
6
7
8
9
10
11
12
13
14
15
16
17
18
19
20
21
22
23
24
25
26
27
28
29
30
31
32
33
34
35
36
37
38
39
| renderAreaNames(configList: AreaNameConfig[]) {
const markers = configList.map((item) => {
let {lat, lng, areaName} = item
const marker = L.marker(L.latLng([lat, lng,]), {
icon: L.divIcon({
className: 'map-marker-item',
html: `<div class="area-mark-item">${areaName}</div>`
})
})
return marker
})
this.areaNameLayerGroup = L.layerGroup(markers)
this.areaNameLayerGroup.addTo(this.map)
},
renderPoints(pointList: PointConfig[]){
const pointerMarkers = pointList.map((item) => {
let {lat, lng, iconId} = item
let iconUrl = `images/map-icon/${iconId}.png`
const marker = L.marker(L.latLng([lat, lng,]), {
icon: L.divIcon({
className: 'map-pointer-item',
html: `
<div class="point-item-container">
<div class="point-pic" style="background-image: url(${iconUrl});">
</div>
</div>`
})
})
return marker
})
this.pointerMarkersLayerGroup = L.layerGroup(pointerMarkers)
this.pointerMarkersLayerGroup.addTo(this.map)
}
|
最后在Home.vue中调用manager
1
2
3
4
5
6
7
8
9
10
11
12
13
14
15
16
17
18
19
20
21
22
23
24
25
26
27
| const map = new MapManager('map')
const markerList = [{
lat: -99.96875,
lng: 125.71875,
areaName: '碧水原'
}, {
lat: -88.125,
lng: 139.40625,
areaName: '苍风高地'
}]
map.renderAreaNames(markerList)
const pointMarkerList = [{
    lat: -90.5625,
    lng: 144.65625,
    iconId: 1
},
    {
        lat: -99.53125,
        lng: 131.65625,
        iconId: 1
    }]
map.renderPoints(pointMarkerList)
map.enableClickDebug()
|